
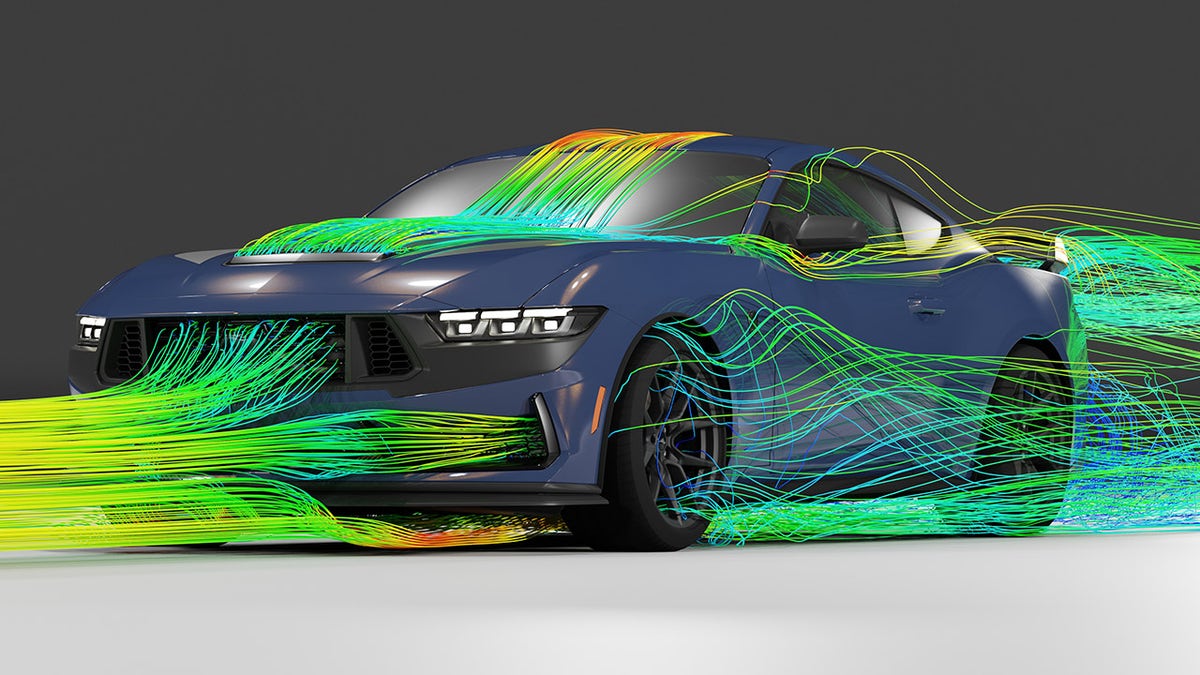
If you believe ads and movies, aerodynamicists spend their time shaping cars while looking all serious and usually pointing at a colorful image on a monitor (see below). That part of the job is called “external aerodynamics,” the study of a flow around a moving object. While it’s a great topic, today I want to talk about its unloved sibling: internal aerodynamics.
[Editor’s Note: Welcome back Manuel Verissimo, our French aerodynamicist who just wants to show folks how things work. Here’s his last article. -DT].


But before looking at how your disgusting meat-based machinery works, we’ll have to do some theorizing again. Yeah, sorry about that, but we have to talk about all the hairy stuff I’ve been conveniently sweeping under the rug up until now: the losses.
The Heat Death Of The Universe
Just like last time, we’ll kick things off with a bit of thermodynamics, you know, as a gentle warm-up. We already know that the first law of thermodynamics fixes the number of Joules in the universe, forcing us to convert existing energies in order to use them (i.e. you can’t create energy). Fortunately, there’s more than enough energy in the cosmos to keep the human anthill running until the sun swallows us whole, but as always, science is here to rain on our parade.
See, if the first law gives us hope that energy will always be there for us, it comes with a big “but,” as Sir Mix-a-lot would put it. One of the types of energy that I haven’t mentioned yet is called “entropy,” and the second law of thermodynamics states that for each energy transformation occurring, entropy has to be created.
This trivial-seeming fact is actually what will be the downfall of the universe. Entropy is a form of heat that cannot be turned into any other form of energy. Some amount of it is created at each transformation, even the natural ones like stars burning. It means that at some point, all of the energy in the universe will be turned into entropy. And things will get a bit hot in here. Or cold, depending on how fast the universe is expanding but that’s not the focus of this article!
[Editor’s Note: I never really thought of Entropy as a form of heat, but rather “randomness.” I asked Mr. Verissimo about this, and he responded:
1. Entropy definitionWhen you compress air with a low efficiency compressor, you get the same pressure at the outlet than with a compressor with high efficiency but with a higher temperature. That extra heat comes from the losses in the process and is due to entropy. The French wikipedia articles illustrates this (https://fr.wikipedia.org/wiki/Entropie_( thermodynamique)#Cons%C3% A9quence_de_l%E2%80%99in%C3% A9galit%C3%A9_de_Clausius_sur_ le_travail_fourni_par_un_syst% C3%A8me) : “[…] On en déduit que le travail utile reçu par le milieu extérieur est plus important lorsque la transformation est réversible que lorsqu’elle est irréversible. La différence est dissipée sous forme de chaleur.”“We can deduce that the work received by the outside environment is more important when the transformation is reversible than when it’s irreversible. The difference is dissipitated in the form of heat.”I stand by my definition even if it may be a little simplistic =)

This is the second law of thermodynamics. No thermodynamic transformation is perfect and therefore cannot it be fully reversed. A simple example is friction. If you rub your hands together, no mechanical work is extracted, but it will create heat. This heat is pure entropy, and you cannot “un-rub” your hands in such a way this it turns it back into mechanical energy. This is called “irreversibility,” and it very much applies to fluids.
Sticky Business
That rubbing is also something that happens with fluids. See, all I’ve taught you last time is true, and our buddy Bernoulli would never lie to us, but his equation — which helps us understand fluid flow — only applies for a given set of simplifying hypotheses. Daniel’s work relies on one small shortcut: “for a non-viscous fluid.” Everything he said is right and it’s definitely helpful in helping us understand how fluids move, but it neglects viscous effects, which create friction and therefore entropy. There are times when ignoring viscous effects makes sense, but for an engineer, he may as well have started his book with “assuming pigs can fly.” Indeed, every fluid is viscous, not just your 10W40.
Viscosity is a fluid’s resistance to shear. Even air is viscous and tends to “stick” to obstacles, meaning if there’s wind blowing, the air speed close to the ground will be null because of viscosity. But the air doesn’t only stick to surfaces, it also sticks … to itself. That creates a gradual variation of speed between zero at ground level to the maximum wind speed found higher above ground. We call the latter area “the free stream,” while the part of the flow where the air has a varying speed closer to the ground is “the boundary layer.” It’s the layer of fluid close to an obstacle where you can feel the effect of said obstacle.

The stickiness of the air means there will be shear within this part of the flow as air “layers” have different speeds, forcing the air molecules to rub against each other. It is like if everyone in the passing lane were swiping your door. That will create friction, and therefore, as we’ve seen previously, entropy. Now, entropy still has to be converted from some other type of energy in its environment, as it is itself a form of energy and has to comply with the first law of thermodynamics. And in our case, it will rob pressure from our flow. And that is how pressure losses occur. Here, let me explain.
Sorry For Your Pressure Loss
Pressure loss is an ever-present issue for internal aero. It forces us to spend energy to have a fluid flowing in a duct (imagine blowing through a thick, short straw and think about how much more energy you have to spend if your straw were longer and had a smaller outlet hole), and I say “duct” in the most general sense of the term! It can be actual piping, an intake manifold or even your blood vessels as the principle applies to liquids as well as gases. If you flow a fluid through a pipe, the pressure will drop more the longer that pipe is.
Estimating accurately the pressure loss occurring in a system is absolutely necessary in order to size both the ducts and pumps (for liquids) or compressors (for gases). Thankfully, there’s a whole bunch of math to do so.
The most basic way to estimate pressure loss is to use the aptly named pressure loss equation:

If you’ve been following this series you must be starting to notice some trends, here. First, us aero people put dynamic pressure in all of our equations (we love dynamic pressure!), and we often glue some dimensionless coefficient (Λ in this case, which is a symbol I can’t even pronounce) next to it to express how this pressure does things and stuff. Exactly like we did in the drag equation.
These similarities are justified, as the pressure loss is sort of the equivalent of drag for internal aero. When you design a car, you want the air to slip around it, while when you design a duct you want the air to slip inside it. As you’re all talented scholars by now I won’t detail all the terms of the equation, but we’ll spend some time with the pressure loss coefficient, because I know you guys love them coefficients.
Empirical Data For The Win Tovaritch!
Remember the drag coefficient article? I said that for a car/plane/cow, the only way to compute drag is to do extensive computer simulation or testing. You can use the same methods for pressure loss (it’s something I was paid to do for turboshaft intakes), but there’s another way that is secretly the envy of all the external aero snobs! Think of it as the pipe blower’s Bible, the Holy Scripture for the air bender, the Good Book of low loss — it’s the world famous and eternal Idel’Cik!!
I know what you’re thinking: What the F?! Indeed. And no, there’s no typo here; that weird name comes from beyond the Ural. See, back in the ’50s, when aerodynamics was a young and sexy science, some dudes in the USSR were about to show Chuck Jaeger up and revolutionize the field forever. A group of nameless scientists – nay, heroes! – whom I can only assume were held up in gulags and forced to work, were tasked to comb through all of the experimental data available on pressure losses and to compile the associated coefficients in a single volume for all the shapes! Yes! All! The! Shapes!
Straight round tubing? Obvs. Bent square tubing? Off course! Abrupt contractions? Natch! Rectangle aspiration chimneys using side openings with louvers and a right angle bend right after? You betcha! All the empirical correlations and weird-ass graphs are in there, allowing you to whip up a quick estimate of a complex fluidic network in a few hours with a good ol’ Excel spreadsheet! Try and do that for your car’s drag coefficient without a supercomputer!


And that’s why every aerodynamicist worth their salt buys a hard cover copy of the Idel’Cik to keep on their nightstand. No one would download a bootleg pdf online, which is ALLEGEDLY shockingly easy to find! Allegedly.
That wonderful piece of literature allows you to define the overall pressure loss coefficient in your fluidic system. That in turn allows you to draw the system’s “characteristic curve” (it basically is a mathematical representation of the system as it pertains to flow passing through it). The graph below plots the pressure loss in your system against the mass flow going through it (remember how mass flow is proportional to speed? Think of it as a figure that accounts for the speed of a fluid as well as the fluid’s mass). A fluid-passage’s characteristic curve is always parabolic, and when we pair it with its pressure-generating cousin, the compressor (or pump) characteristic curve, we can deduce the whole system “operating point.”

[Editor’s Note: I had to create these characteristic curves all the time when developing cooling systems. Every time you add a heat exchanger to a system, reduce a hose or fitting diameter, or had a new expected fluid temperature, you had to create new characteristic curves. (OK, in reality it was all built into simulations). -DT].
Pump It Up
Now that we’ve built ourselves a nice loss model, we’ve gotta take a look at the engine of our system: the pump. Unlike what the manufacturer’s spec sheet would have you believe, a pump doesn’t simply deliver a flow and a pressure irrelevant of what’s behind it. (A pump sending coolant through a restricted hose isn’t going to produce as much flow as if it were sending fluid through a wide-open hose. The parabolic characteristic curve helps us mathematically define the “restriction” so we can understand how different physical plumbing would change fluid flow with a given pump).
Let’s consider your squishy disgusting breathing apparatus. When you are well, and your nose isn’t chock full of mucus, your lungs provide an ample flow of air, with little pressure in your nose and hardly any effort on your part. But, when you spend a drunken night licking the stuff that oozes out the trash bags behind the hospital at the height of the flu season, the airflow provided by your pump decreases. Meanwhile, the pressure you can feel behind the crap-based occlusion in your nostrils goes through the roof. It gets hard to breathe, and takes a real effort to keep your brain oxygenated.
Your lungs got neither weaker nor smaller, but their operating point moved because of a change in the losses in your ducting. The same thing can happen with your car’s fuel system. The fuel pump doesn’t deliver the same amount of gas if your fuel filter clogs up. And when your 1976 fuel tank is David-Tracy-levels of rusty, the filter can get so filled with merde that the pump becomes unable to deliver enough fuel flow, which will make your engine stall. Ask me how I know.
This little adventure I had can be analyzed using a pressure loss graph and the fuel pump characteristic curve.

The black line defines the pump characteristic curve in term of discharge head (how much back pressure it can defeat) and the associated flow it can provide in those conditions. Its shape is quite classic here. It provides a lot of discharge when little flow goes through it and a lot of flow if there’s little back pressure to overcome. When you plug the ducting downstream (or upstream) of the pump, it generates more pressure to compensate for the added losses, but provides less flow.
The green line represents the nominal loss curve of your fuel system with a clean filter (less of a pressure drop across the filter due to no blockage). The intersection of both curves is your nominal operating point: it is where the pump precisely overcomes the losses and where your system finds its equilibrium. As your filter gets clogged, the loss curve moves upwards until reaching the red curve, at which point the new operating pressure of the pump doesn’t provide sufficient flow for your engine (8 kg/h is the stall limit, as you can see), and that’s when you’re stranded on the side of the road, covering yourself in fuel as you try and clean that putain de filter for the fifth time!!
Being able to estimate the loss characteristics of your fluidic network and knowing how a pump behaves is critical to understand if you want to design a fuel/cooling/lubrication/HVAC/turbo system. Indeed, you can’t manipulate flow independently of pressure, and you should always be aware that your ducting will affect both.
Let’s imagine you want to “upgrade” your fuel pump for some reason, and you’re given options for a “high flow pump” that has a higher max flow, or a “high pressure pump” with a higher maximum pressure. You could think either of these is better than your boring OEM pump, but that’s something you cannot state without knowing the complete performance curve of each pump. Let’s illustrate this with the previous use case:

The fuel ducting remained the same, but I’ve shown our initial pump along with the two “upgraded ones.” The blue curve starts indeed at a higher pressure (16kPa instead of 12 kPa), and the orange one has a higher max flow than the two other ones (14 kg/h instead of 12 kg/h). However, all three pumps intersect the clean fuel system pressure loss curve at the exact same point, making both “racing pumps” no better than the OEM.
What will change however is how the entire system will react when some clogging occurs. The high pressure pump will give us more flow than the OEM pump when a restriction in the fuel passage occurs, but the high flow one will provide less flow! My point is you can’t judge a pump based on a single number, and that’s why car manufacturers have R&D teams dedicated to the subject. And I can assure you they do more than picking them in the performance section of Rockauto!
These principles could apply to everything that uses liquids (lubrication systems, pipelines, blood vessels…) or gases (HVAC, turbos, aircraft engines…). The latter adds some complexity for a lot of reasons I won’t address right now, but if I did my job right, you should have a working knowledge of internal fluid mechanics. So now go and design a whole new fuel system for your car!
(The Autopian declines all responsibility in case of injury or fiery death if you design a whole new fuel system for your car).


Came here for the fact jokes but only saw the promise of them never found them. But a question formed is the difficulty of transporting fluid unblocked in a large length the same technology as transporing fluid in a partially blocked but short pipe?
For anyone that was as confused as I was, the book isn’t actually called the Idel’Cik. The author of the book is named I.E. Idel’Cik and the book is called the “Handbook of Hydraulic Resistance”.
Also, the US Nuclear Regulatory Commission have a free pdf copy available for download on their website. Hardly a “bootleg” copy, but one worth having.
Making some popcorn for when turbulence, Reynolds, Nusselt, Prandtl etc enter the chat 🙂
*Laughs in Post-Traumatic-Unit-Operations-Lecture-Disorder*
I’m a sucker for a deep dive, but I’m no sadist, I’m going to keep you safe from those, Navier-Stokes and the really hairy stuff.
Although it’d be cool to address the Shilton-Colburn analogy… so maybe some day?
This is maddeningly complicated and I’m here for it
Great article
Thank you!
Since there have been a couple of mentions of this being relevant to the human body, too, I feel a bit of a need to nerd out.
The human body (and presumably that of most vertebrates but I’m not a veterinarian) has evolved a couple of ingenious mechanisms to deal with dynamic pressure changes. From blood vessels constricting and expanding to heart rate increasing or decreasing depending on blood/oxygen supply and demand to your kidneys excreting or retaining water to keep pressure constant there is an incredibly complex system at work.
Perhaps one of the most ingenious and yet obscure mechanisms is the Frank-Starling-Law: Basically, human muscle cells in general and heart muscle cells in particular have a certain range of motion from completely contracted to maximally extended and they tend to be at their strongest somewhere in the middle (the reasons are not fully explored, but it is probably due to both a better overlap of the active muscle proteins and higher sensitivity to calcium, which acts as the signal for the muscle cell to contract).
Now this leads to an interesting effect that makes you heart self-regulate on each and every heartbeat:
If the volume of blood reaching the heart (the preload) is increased for any reason, then the muscular pre-stretching is also increased, which leads to increased pumping strength and therefore a higher ejected blood volume, compensating for the increased amount of blood needing pumping.
Similarly, if the resistance in the aorta (or the pulmonary arteries for the right ventricle, the so-called afterload) is increased, the heart initially pumps less blood (higher pressure necessary to reach equilibrium with the aorta before the aortic valve opens, therefore less time left in the cycle to eject volume) leading to an increased pre-fill and therefore pre-stretching of the heart muscle cells on the following beat, which means more power to overcome the increased resistance and higher ejected volume on the following beat.
Now consider the following: every time you inhale you reduce the pressure inside your chest cavity for a moment and every time you exhale, the pressure is increased. This means, among other things, that when you inhale the blood flow to the right side of your heart is increased (think of the underpressure in your chest basically sucking blood into the venous blood vessels) and flow to the left ventricle is decreased (because the blood vessels in your expanding lungs “suck up” an amount of blood) and vice versa for exhalation. So this Frank-Starling-Mechanism automatically and with basically no interference on the part of your nervous system, purely operating off of the physical properties of your muscle cells, helps balance out the changes happening during one of the most constant and basic rhythms of your body.
Engineering might be complex, but biology is no slouch, either.
Holly shit that’s amazing! Thanks for teaching me too!
Very neat info! Stuff like this blows my mind, like the time I found out that the body has a few soft reset procedures, one of them being the Valsalva Maneuver (and the Modified Valsalva) that can clear sinuses and correct certain types of arrhythmia. Another time, a friend explained to me what an ECG is graphing and how to read one…it broke my brain and I don’t remember anything beyond “It reads the depolariation of electricity across the heart over time”
Yeah I love stuff like this. Learning how things work is my favourite hobby. Happy that somebody else shares that fascination.
As for the ECG, basically the spikes show whether “electricity” is flowing towards or away from the electrode. So if you know where the electrode is in relation to the heart, you can guesstimate how the signals are traveling and interpolate the condition of the pathways they are traveling on, for example after a heart attack, signals might take an unusual route because conductive heart muscle tissue has been replaced by non-conductive sar tissue.
Years ago, my family hosted a series of people on fellowships who were doing research at a cardiac institute in our city, where a friend of our family were full-time research leads, and I remember them pouring over an ECG reading from an experiment. The charts looked the same to me, but they could point out very minute differences in the waves
Later I found out the head of that institute (whose name escapes me at the moment) did a bunch of research decades ago that led to modern defibrillation techniques and was an academic expert on how the heart behaves before and after heart attacks
Nice one, Manuel!
And topical: this morning I looked at a hvac unit rated at a ton & a half supplying one 6” grill over 100’ away, and another 30’ the other direction —with an 8”x8” grill for a return. It’s been a couple of years since my psychometric course, but I’m thinking to myself that that is one looong freaking straw-and that a unit that size can’t breath through that tiny 8×8….
Then I see this. Made me grin: thanks!
I can open up the Idel’cik and check if their math works out! Any idea what kind of mass flow goes in there?
400 cubic feet per minute per ton is what is rattling around in the back of my head, but no idea of mass. I’m positive that the unit cannot breath properly just given supply & return sizes-much less the length of that first supply run.
Have to head out to see family or I’d be digging out my textbooks
And I have to go to bed! I may try and take a look at your HVAC problem tomorrow if I muster the courage to convert your units from hell!
thermodynamics for non-technical staff:
1st law – there is no free lunch
2nd law – the gratuity is included in the bill
Pretty much!
C’mon, David, Muse even wrote a song about The 2nd Law…
https://www.youtube.com/watch?v=EF_xdvn52As
Oh hey, a song from the penultimate good Muse album
For me as a lay person this article starts out interesting but rapidly descends into mental chaos. Far too much information given in one article. You are taking a subject that would be half a semester in H/S and dumping it all out at once. What your article needs is a lesson plan consisting of lessons on each element of your core subject, followed by a sumation.
As presented this article has very little practical value!
First of all, thanks for your feedback: I need to know when the deep dive goes too deep.
Know that this article will be the last time so much theory is addressed, and I have more concrete subjects coming in. Hopefully they’ll be more digestible.
Consider examining fuel pump upgrades one at a time. There already exists a graph for the stock pump. Perhaps show one graph for high pressure pump and another graph for high flow pump before they are all put together as per “Fuel system diagram 2”.
I’m not really a lay person, more a dilettante, but I think that it’s nice having an article that goes deep instead of something I don’t learn anything of.
Insert snarky comment here.
Fwiw, I liked it.
Super article, merci beaucoup pour ces explications claires et agréables à lire.
Mais de rien !
Great article, and I love the opener, starting with theory. Still, I can’t shake the suspicion that “Manuel Verissimo” is a David Tracy pseudonym, deployed in order to write about functional, rust-free automotive components. Has anyone seen DT and “Manuel” simultaneously?
Notice that I’m conviniently “French” to explain that!
Great article! One question – when you’re building these models, do you also have to generate different curves based on temperature? I imagine the changing viscosity will impact the system performance significantly.
So when you deal with air, you’d actually use a “corrected mass flow” which is an image of the Mach number (W.T^0.5/P)
For liquids where viscosity is much more sensitive to temperature I don’t know if that works so you may need to do an array depending on the temps.
Very interesting stuff. I got smarter today. Thanks.
That’s what I’m going for! Glad it was to your liking.
so you do accept responsibility when I redesign the flow profile through my veins? Good to know
* walks away thinking about how to connect a supercharger to my heart and coat my veins with teflon *
but nice article!
Fun fact: your blood is already polluted by Teflon!
Slick 50 strikes again!
https://www.ftc.gov/news-events/news/press-releases/1996/07/quaker-state-ads-slick-50-are-false-misleading-ftc-charges
Last diagram has an orange line in the graph and purple one in the legend for the high pressure pump
That’s because Microsoft sucks ass and excel can’t talk to word properly!
never do in excel what you could do in origin
Wait, there’s a superior alternative to excel?
Love that attention to detail! (resolved!)
If I’m reading the table right, now the high flow and high pressure lines are reversed in the legend–seems like the orange line should be high flow and the light blue should be high pressure.
That’s what I was thinking, but I have a Fine Arts degree so it’s likely that I don’t know what the heck I’m talking about!
“I said that for a car/plane/cow, the only way to compute drag is to do extensive computer simulation or testing”
Eh, all you need is 4(pi)r^2:
https://en.m.wikipedia.org/wiki/Spherical_cow
Its all plug and chug from there.
postulate a spherical car…
“postulate a spherical car…”
No problem. Just take this:
http://3.bp.blogspot.com/-naZ88lcotTk/UNikh17WrNI/AAAAAAAAECw/p-oralZfhgs/s1600/hamster-ball.jpg
With this:
https://chud.com/wp-content/uploads/2012/03/6_23_11_TheIT.jpg
That would be the physicist’s approach. The engineer will 3D scan a cow to make simulations!
And mumble angrily under their breath about the damn Reynolds numbers while doing it.
Size freakin’ matters!